[](https://www.npmjs.com/package/claude-code-templates)
[](https://www.npmjs.com/package/claude-code-templates)
[](https://opensource.org/licenses/MIT)
[](CONTRIBUTING.md)
[](https://z.ai/subscribe?ic=8JVLJQFSKB&utm_source=github&utm_medium=badge&utm_campaign=readme)
[](https://claude.com/contact-sales/claude-for-oss)
[](https://get.neon.com/4eCjZDz)
[](https://github.com/sponsors/davila7)
[](https://buymeacoffee.com/daniavila)
[](https://github.com/davila7/claude-code-templates)
<p align="center">
<a href="https://trendshift.io/repositories/15113" target="_blank">
<img src="https://trendshift.io/api/badge/repositories/15113" alt="davila7%2Fclaude-code-templates | Trendshift" style="width: 200px; height: 40px;" width="125" height="40"/>
</a>
<br />
<br />
<a href="https://vercel.com/oss">
<img alt="Vercel OSS Program" src="https://vercel.com/oss/program-badge.svg" />
</a>
<a href="https://get.neon.com/4eCjZDz">
<img alt="Neon Open Source Program" src="https://img.shields.io/badge/Neon-Open%20Source%20Program-00E599?style=for-the-badge" />
</a>
<a href="https://claude.com/contact-sales/claude-for-oss">
<img alt="Claude for Open Source" src="https://raw.githubusercontent.com/davila7/claude-code-templates/HEAD/docs/claude-oss-badge.svg" height="48" />
</a>
</p>
---
<p align="center">
<a href="https://www.swiftproxy.net/" target="_blank">
<picture>
<source media="(prefers-color-scheme: dark)" srcset="docs/sponsors/swiftproxy-dark.png" />
<source media="(prefers-color-scheme: light)" srcset="docs/sponsors/swiftproxy-light.png" />
<img src="https://raw.githubusercontent.com/davila7/claude-code-templates/HEAD/docs/sponsors/swiftproxy-light.png" alt="Swiftproxy" width="300" />
</picture>
</a>
</p>
<h3 align="center">Sponsored by <a href="https://www.swiftproxy.net/">Swiftproxy</a></h3>
<p align="center">
<b>Swiftproxy proudly supports this project.</b><br />
Connect your AI-powered workflows to reliable residential proxies for web data collection, browser automation, and AI-driven research.<br />
90M+ residential IPs across 220+ locations, rotating and static residential proxies, with HTTP(S) and SOCKS5 support.
</p>
<p align="center">
<a href="https://www.swiftproxy.net/">
<img src="https://img.shields.io/badge/Get%2010%25%20off-code%20PROXY90-2563eb?style=for-the-badge" alt="Get 10% off with code PROXY90" />
</a>
</p>
---
# Claude Code Templates ([aitmpl.com](https://aitmpl.com))
**Ready-to-use configurations for Anthropic's Claude Code.** A comprehensive collection of AI agents, custom commands, settings, hooks, external integrations (MCPs), and project templates to enhance your development workflow.
## Browse & Install Components and Templates
**[Browse All Templates](https://aitmpl.com)** - Interactive web interface to explore and install 100+ agents, commands, settings, hooks, and MCPs.
<img width="1787" height="958" alt="image" src="https://github.com/user-attachments/assets/d84feaa4-f871-4843-bbee-42d8f51b2f21" />
## 🚀 Quick Installation
```bash
# Install a complete development stack
npx claude-code-templates@latest --agent development-team/frontend-developer --command testing/generate-tests --mcp development/github-integration --yes
# Browse and install interactively
npx claude-code-templates@latest
# Install specific components
npx claude-code-templates@latest --agent development-tools/code-reviewer --yes
npx claude-code-templates@latest --command performance/optimize-bundle --yes
npx claude-code-templates@latest --setting performance/mcp-timeouts --yes
npx claude-code-templates@latest --hook git/pre-commit-validation --yes
npx claude-code-templates@latest --mcp database/postgresql-integration --yes
```
## What You Get
| Component | Description | Examples |
|-----------|-------------|----------|
| **🤖 Agents** | AI specialists for specific domains | Security auditor, React performance optimizer, database architect |
| **⚡ Commands** | Custom slash commands | `/generate-tests`, `/optimize-bundle`, `/check-security` |
| **🔌 MCPs** | External service integrations | GitHub, PostgreSQL, Stripe, AWS, OpenAI |
| **⚙️ Settings** | Claude Code configurations | Timeouts, memory settings, output styles |
| **🪝 Hooks** | Automation triggers | Pre-commit validation, post-completion actions |
| **🎨 Skills** | Reusable capabilities with progressive disclosure | PDF processing, Excel automation, custom workflows |
## 🛠️ Additional Tools
Beyond the template catalog, Claude Code Templates includes powerful development tools:
### 📊 Claude Code Analytics
Monitor your AI-powered development sessions in real-time with live state detection and performance metrics.
```bash
npx claude-code-templates@latest --analytics
```
### 💬 Conversation Monitor
Mobile-optimized interface to view Claude responses in real-time with secure remote access.
```bash
# Local access
npx claude-code-templates@latest --chats
# Secure remote access via Cloudflare Tunnel
npx claude-code-templates@latest --chats --tunnel
```
### 🔍 Health Check
Comprehensive diagnostics to ensure your Claude Code installation is optimized.
```bash
npx claude-code-templates@latest --health-check
```
### 🔌 Plugin Dashboard
View marketplaces, installed plugins, and manage permissions from a unified interface.
```bash
npx claude-code-templates@latest --plugins
```
## 📖 Documentation
**[📚 docs.aitmpl.com](https://docs.aitmpl.com/)** - Complete guides, examples, and API reference for all components and tools.
## Contributing
We welcome contributions! **[Browse existing templates](https://aitmpl.com)** to see what's available, then check our [contributing guidelines](https://github.com/davila7/claude-code-templates/blob/HEAD/CONTRIBUTING.md) to add your own agents, commands, MCPs, settings, or hooks.
**Please read our [Code of Conduct](https://github.com/davila7/claude-code-templates/blob/HEAD/CODE_OF_CONDUCT.md) before contributing.**
## Attribution
This collection includes components from multiple sources:
**Scientific Skills:**
- **[K-Dense-AI/claude-scientific-skills](https://github.com/K-Dense-AI/claude-scientific-skills)** by K-Dense Inc. - MIT License (139 scientific skills for biology, chemistry, medicine, and computational research)
**Official Anthropic:**
- **[anthropics/skills](https://github.com/anthropics/skills)** - Official Anthropic skills (21 skills)
- **[anthropics/claude-code](https://github.com/anthropics/claude-code)** - Development guides and examples (10 skills)
**Community Skills & Agents:**
- **[obra/superpowers](https://github.com/obra/superpowers)** by Jesse Obra - MIT License (14 workflow skills)
- **[alirezarezvani/claude-skills](https://github.com/alirezarezvani/claude-skills)** by Alireza Rezvani - MIT License (36 professional role skills)
- **[wshobson/agents](https://github.com/wshobson/agents)** by wshobson - MIT License (48 agents)
- **NerdyChefsAI Skills** - Community contribution - MIT License (specialized enterprise skills)
**Commands & Tools:**
- **[awesome-claude-code](https://github.com/hesreallyhim/awesome-claude-code)** by hesreallyhim - CC0 1.0 Universal (21 commands)
- **[awesome-claude-skills](https://github.com/mehdi-lamrani/awesome-claude-skills)** - Apache 2.0 (community skills)
- **move-code-quality-skill** - MIT License
- **cocoindex-claude** - Apache 2.0
Each of these resources retains its **original license and attribution**, as defined by their respective authors.
We respect and credit all original creators for their work and contributions to the Claude ecosystem.
## 📄 License
This project is licensed under the MIT License - see the [LICENSE](https://github.com/davila7/claude-code-templates/blob/HEAD/LICENSE) file for details.
## 🔗 Links
- **🌐 Browse Templates**: [aitmpl.com](https://aitmpl.com)
- **📚 Documentation**: [docs.aitmpl.com](https://docs.aitmpl.com)
- **💬 Community**: [GitHub Discussions](https://github.com/davila7/claude-code-templates/discussions)
- **🐛 Issues**: [GitHub Issues](https://github.com/davila7/claude-code-templates/issues)
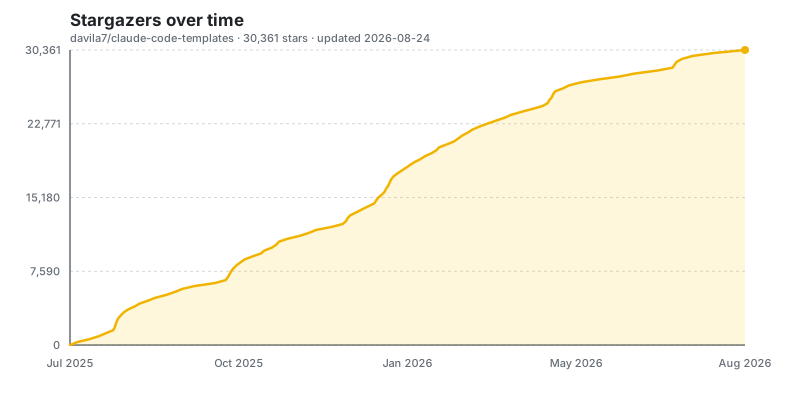
## Stargazers over time
[](https://www.aitmpl.com/component/skill/git/star-history-chart)
---
**⭐ Found this useful? Give us a star to support the project!**
[](https://github.com/sponsors/davila7)
[](https://buymeacoffee.com/daniavila)